Forecasting LF DX windows
This is probably an ambitious title, but I have tried, based on experience of watching long distance propagation over the last 3 years, to analyse the geomagnetic conditions over the last solar cycle. The intention was to determine what the possibilities would be for good DX conditions at distances greater than 3000 kms during the solar minimum. Experience with practical amateur aerials has shown that contacts over distances of 2000 to 3000 kms are obtainable in daytime, for well equiped stations. The longer Trans-Atlantic contacts, and contacts (from Europe) with Asia and South America will most probably be limited to night-time paths.
As I have stated in other articles whilst it is easily possible to forecast a spell of poor conditions, it is by no means easy to predict the timing of favourable conditions. Night-time propagation depends on the signals at 136kHz being returned in the direction of the Earth's surface by the ionised region refered to as the E-layer. I believe that it is possible that the "reflection" is probably from the lower boundaries of the E-layer ,at a altitude of about 100kms. The night-time E-layer seems to be a fairly stable area it main source of ionisation being cosmic rays. Thus the variations in strength of long distance signals at night are due to the effects of absorbtion in the lower D-layer, or the result of multi-path interference at the point of reception. It is these two mechanisms that make the prediction almost impossible. Absorption alone would be easy to quantify, but when combined with it differing effects on two of more paths between transmitter and receiver, the analysis becomes very complex.
Generally under quiet conditions the D-layer which is ionised by a photo-dissociation process, produces high absorption in daytime when the region is subject to UV rays from the Sun. As the Sun sets and the ionising radiation is removed the ionisation decays quite rapidly, and the daytime absortion disappears. This allows the LF signals to reach and be "reflected" back by the E-layer. During periods of geomagnetic activity, geomagnetic storms result in electrons being injected into the ionospere at the poles (often refered to as "precipitated" electrons.) These are very energetic electrons, which means that, on encountering a neutral atom or positive ion, they are more likely to bounce off, than be captured. Thus, once the D-layer has been populated with these pecipitated electrons, it takes a few days for the ionisation levels to return to normal. In general the stronger the storm, the longer the after-effects will linger, and the longer the night-time propagation will be depressed, by the extra absorption produced by these "hot" electrons. It is also observed that the absorption levels do not build up immediately at the time of the geomagnetic storm. There may be immediate effects at and in the vicinty of the poles, such as visible aurora, but it generally takes two to three days for the electons to diffuse down to the lower levels and lower lattitudes. Thus occasionally conditions may seem excellent coincidental with a geomagnetic storm. This can be particularly the case if the storm ends a two week quiet period. The absorption following a geomagnetic storm can reduce received signal levels by 10 to 12 dB below those received during quiet conditions.
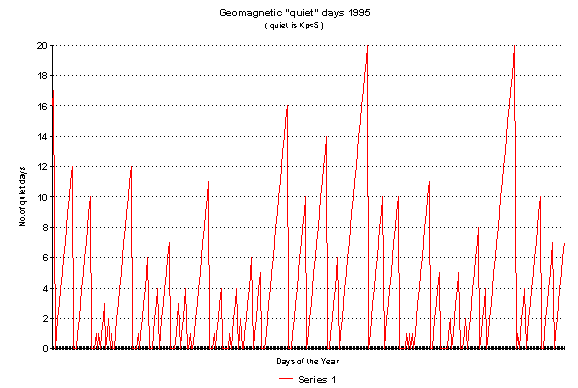
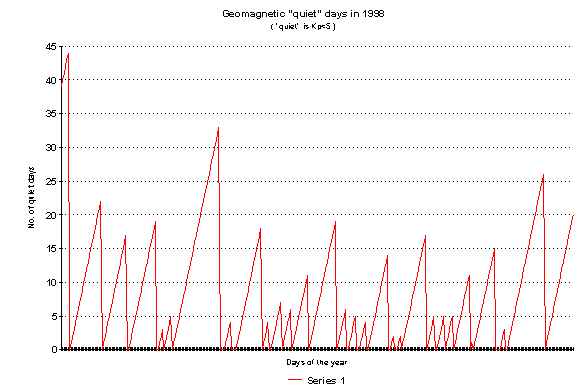
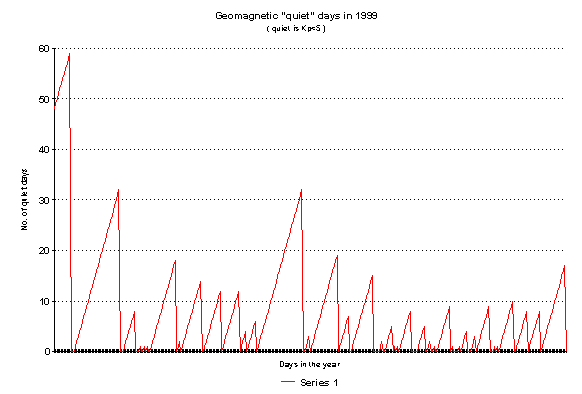
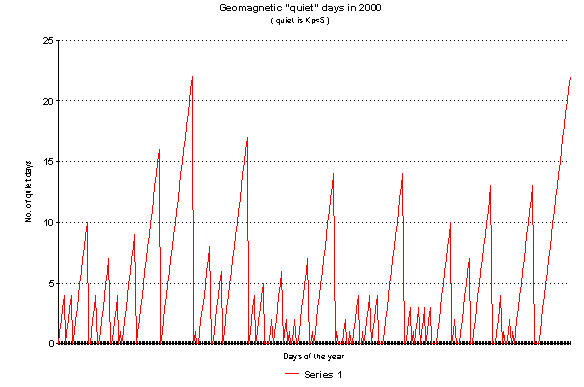
Whilst we have seen good received signals during quiet conditions these are not the best available. There would seem to be a condition occuring on the tail of a geomagnetic disturbance that enhances multipath propagation in such a way as to favour constructive interference for significant periods (60 to 90 minutes) at localised reception areas. These exceptional conditions can lead to a further 6 to 10 dB boost to signal levels over quiet conditions. This sort of state can also be triggered during a long quiet spell by the rise in geomagnetic activity for low levels to "active" levels (Kp=4). This occured in January 2003 and was the event that initiated this analysis. The supposition was that this promised that good propagation conditions could be available through the quiet Solar years, provided there was sufficient activity to initiate the constuctive interference. I am unable to find any way of determining the future geomagnetic activity so the next best thing was to assume it would be somewhat similar to the last cycle. I have analysed the records of Geomagnetic activity issued by the NOAA Space Enviroment Centre, to determine the length, and number of "quiet" periods in each year. Data is available back to 1994, which is on the downward slope of the last solar cycle. From experience I have only considered a Planetary-K Index of 5 or greater as destroying good conditions, though the effect of a minor bout of activity like Kp=4 depends very much on the status of the ionosphere at the time of the activity. If the D-layer is slowly recovering from a major storm, and increase of Kp to 4 will delay the recovery. If there has been a long quiet period a rise of Kp to 4 may initiate improved conditions. The apex value of the triangles gives the number of consecutive quiet days
I suggest a possible way of using my plots would be to determine the highest Kp index preceeding the quiet period of interest, and then allow a minimum number of days to elapse to the absorption to decay away. My rough estimates as as follows....it is no means definitive. It is based on the thought that the higher the index, the bigger the effect, then the more electrons are injected, so the longer it takes for them to recombine. The figures are loosely based on some empirical observations.
| Index Kp | Days to recover |
| 5 | 5-7 |
| 6 | 7-12 |
| 7 | 10-16 |
| 8 | 14-21 |
| 9 | 21-28 |
As a start it is interesting to look at the number of times there were 15 or more quiet days, which is enogh to recover from a Kp index or about 7. Overall, it looks as though DX of greater 3000kms should be available right through the solar minimum, if of course there is someone listening at the far end !! Also note that there are a significant proportion of promising periods that occur at the middle of the year, outside to so called "DX season".
Text files with annual tables of the daily values of the K and A indexes for years 1994 to 2003 can be found at the NOAA Space Environment Centre site at :-
http://www.sec.noaa.gov/ftpmenu/indices/old_indices.html


